top of page
Economics explained
Category:
Demand and supply
Supply curve
The secret to scoring awesome grades in economics is to have corresponding awesome notes.
A common pitfall for students is to lose themselves in a sea of notes: personal notes, teacher notes, online notes textbooks, etc... This happens when one has too many sources to revise from! Why not solve this problem by having one reliable source of notes? This is where we can help.
What makes TooLazyToStudy notes different?
Our notes:
-
are clear and concise and relevant
-
is set in an engaging template to facilitate memorisation
-
cover all the important topics in the O level, AS level and A level syllabus
-
are editable, feel free to make additions or to rephrase sentences in your own words!
Looking for live explanations of these notes? Enrol now for FREE tuition!
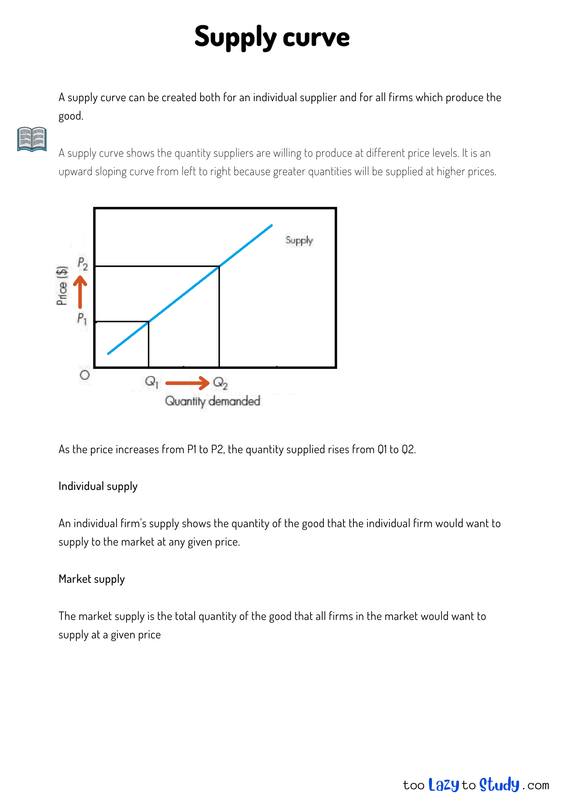
A supply curve can be created both for an individual supplier and for all firms which produce the good.
A supply curve shows the quantity suppliers are willing to produce at different price levels. It is an upward sloping curve from left to right because greater quantities will be supplied at higher prices.
As the price increases from P1 to P2, the quantity supplied rises from Q1 to Q2.
Individual supply
An individual firm's supply shows the quantity of the good that the individual firm would want to supply to the market at any given price.
Market supply
The market supply is the total quantity of the good that all firms in the market would want to supply at a given price
bottom of page