Economics explained
Category:
Market structures
Oligopoly - diagram
The secret to scoring awesome grades in economics is to have corresponding awesome notes.
A common pitfall for students is to lose themselves in a sea of notes: personal notes, teacher notes, online notes textbooks, etc... This happens when one has too many sources to revise from! Why not solve this problem by having one reliable source of notes? This is where we can help.
What makes TooLazyToStudy notes different?
Our notes:
-
are clear and concise and relevant
-
is set in an engaging template to facilitate memorisation
-
cover all the important topics in the O level, AS level and A level syllabus
-
are editable, feel free to make additions or to rephrase sentences in your own words!
Looking for live explanations of these notes? Enrol now for FREE tuition!
The difficulty in studying oligopoly is that the behaviour of firms can follow two different routes –
in some industries, there may be cut-throat competition between aggressive fi rms
while in others, there may well be cooperation or tacit evidence of collusion.
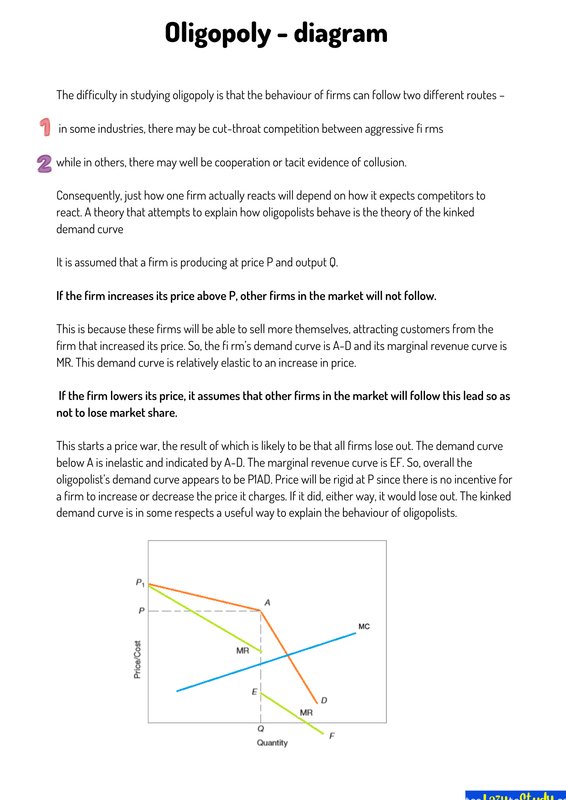
Consequently, just how one firm actually reacts will depend on how it expects competitors to react. A theory that attempts to explain how oligopolists behave is the theory of the kinked demand curve
It is assumed that a firm is producing at price P and output Q.
If the firm increases its price above P, other firms in the market will not follow.
This is because these firms will be able to sell more themselves, attracting customers from the firm that increased its price. So, the fi rm’s demand curve is A-D and its marginal revenue curve is MR. This demand curve is relatively elastic to an increase in price.
If the firm lowers its price, it assumes that other firms in the market will follow this lead so as not to lose market share.
This starts a price war, the result of which is likely to be that all firms lose out. The demand curve below A is inelastic and indicated by A-D. The marginal revenue curve is EF. So, overall the oligopolist’s demand curve appears to be P1AD. Price will be rigid at P since there is no incentive for a firm to increase or decrease the price it charges. If it did, either way, it would lose out. The kinked demand curve is in some respects a useful way to explain the behaviour of oligopolists.