Overview
If people make choices on the basis of what’s going to bring them the most happiness, they need a way of comparing how much happiness each option brings.
Utility
Economists suppose that you can compare all possible things that you may experience with a common measure of happiness or satisfaction, which they call utility.
Two important measures are:
Total utility
The overall satisfaction that is derived from the consumption of all units of a good over a given time period.
Marginal utility
The additional utility is derived from the consumption of one more unit of a particular good.
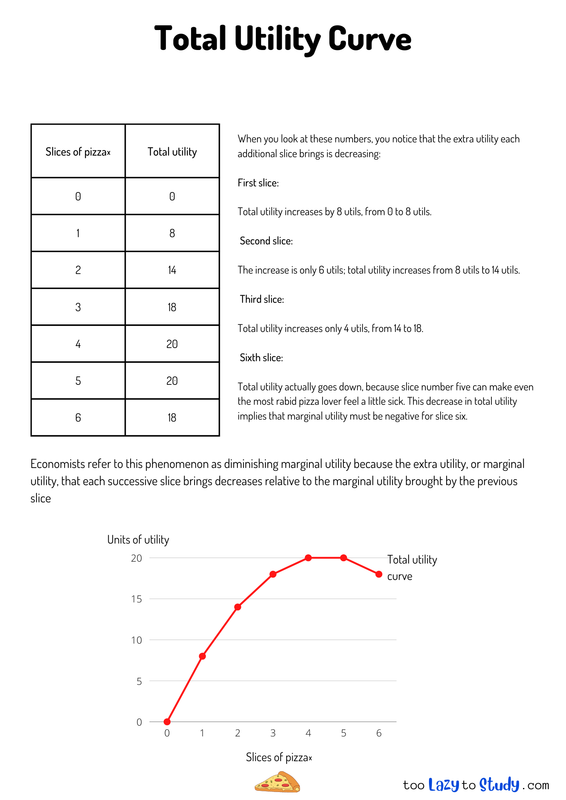
When you look at these numbers, you notice that the extra utility each additional slice brings is decreasing:
First slice:
Total utility increases by 8 utils, from 0 to 8 utils.
Second slice:
The increase is only 6 utils; total utility increases from 8 utils to 14 utils.
Third slice:
Total utility increases only 4 utils, from 14 to 18.
Sixth slice:
Total utility actually goes down, because slice number five can make even the most rabid pizza lover feel a little sick. This decrease in total utility implies that marginal utility must be negative for slice six.
.png)
Economics notes on
Total Utility Curve
Perfect for A level, GCSEs and O levels!